Facebook Advanced Analytics Explained: What Still Works in 2025
Facebook Advanced Analytics used to share enhanced insights in one place. Now, you have to piece together insights from Ads Manager, Events Manager, and Business Suite to get the answers you need.
If you want to know which video hook drove conversions or which creative flopped after Day 3, you’ll need more than what Meta shows. This guide explains what’s still possible in-platform and how tools like Bestever help close the gap.
In this article, we’ll cover:
- What happened to the Facebook Analytics tool
- What Facebook Advanced Analytics are now
- Key metrics you should track
- What Meta doesn’t show you
- Tools you can use instead
- Best practices
Let’s start by looking at what happened to Facebook Analytics and what changed.
What happened to Facebook Analytics?
Meta discontinued Facebook Analytics on June 30, 2021, officially removing access on July 1. The platform helped advertisers track user behavior across websites, apps, and Facebook properties in one view. Teams could follow the full journey from ad click to purchase and spot drop-offs along the way.
After the shutdown, Meta replaced it with a mix of tools:
- Ads Manager: Tracks campaign, ad set, and creative performance
- Events Manager: Handles pixel and server-side event tracking
- Meta Business Suite: Offers basic page insights and post scheduling
- Audience Insights: Shows limited demographic and interest data
Performance teams still feel the gap. These tools provide surface-level results, but none combine creative, audience, and funnel insights in a single place. Teams either settle for disconnected data or build custom dashboards just to answer basic questions.
What are Facebook Advanced Analytics now?
Advanced analytics on Facebook now refers to using multiple Meta tools together to monitor ad performance and user actions. Advertisers rely on Ads Manager, Events Manager, and Business Suite to fill the gap left by the old Analytics platform.
Ads Manager covers campaign-level reporting. You can track metrics like click-through rate (CTR), return on ad spend (ROAS), impressions, cost per result, and frequency. It lets you break down performance by age, gender, placement, and device.
Events Manager tracks actions through the Meta Pixel and Conversions API. You can verify events like purchases, leads, and sign-ups. This tool is key for making sure your data stays accurate, especially with iOS privacy changes and server-side tracking.
These tools give you numbers, but they don’t provide context. You can’t compare creative performance beyond surface KPIs. You won’t see which visual hooks drive clicks, how messaging affects conversions, or what changed after Day 3 of a campaign. If you want answers like that, you’ll need to layer in outside tools.
Key Facebook Ads metrics to track in 2025
Meta still provides core performance metrics that help you measure cost, engagement, and creative effectiveness. Here’s what to track:
- CTR: Shows how often people click after seeing your ad. Low CTR usually means the creative isn’t engaging or the targeting is off.
- CPC (cost per click): Tells you how much each click costs. A rising CPC can point to a poor audience match or an underperforming creative.
- CPM (cost per 1,000 impressions): Measures how much you pay to show your ad 1,000 times. Watch for sudden increases, which often signal creative fatigue.
- ROAS: Calculates how much revenue your ads generate. If you spend $1,000 and earn $4,000, your ROAS is 4x. Use this to identify scale-worthy campaigns.
- Purchase conversion value: Tracks the dollar value of purchases tied to your ad. Helps you understand which audiences or creatives drive the most revenue.
- Frequency: Shows how often each person sees your ad. High frequency can lead to audience fatigue and lower engagement.
- Delivery: Tells you how Meta spreads your ad across placements and devices. Uneven delivery can hide weak performance in specific segments.
- Scroll depth and thumb-stop ratio: Meta doesn’t report these directly. Tools like Bestever estimate attention patterns using hold rates, hooks, and creative tags to show where people stop or drop off.
What Meta doesn’t show you
Meta shows you what happened in your campaigns, but not why it happened. You can track CTR, ROAS, and impressions, but you won’t see what made an ad succeed or fail.
Here’s what Meta doesn’t show you:
- Creative performance scoring: Meta doesn’t grade your visuals or messaging. You can use a tool like Bestever to tag each creative by hook, CTA, and format so you can spot patterns in top-performing ads.
- Predictive insights for new ads: Meta doesn’t suggest what to test next. Bestever uses your past results to highlight which styles, tones, or formats tend to convert.
- Side-by-side creative comparisons: Meta splits reports by ad set and campaign. Bestever stacks your videos, user-generated content (UGC), and carousels in one view so you can compare them across hold rate, ROAS, and more.
What advanced analytics should tell you
Advanced analytics in FB should help you see when performance shifts, understand what caused it, and know what to fix next.
These hypothetical examples show how tools like Bestever can help you answer real questions using creative and performance data:
Scenario 1: CTR is high, but ROAS is low
Your ad gets a 3% CTR, which looks strong. But return on ad spend is below 1x. This likely means the creative doesn’t match the landing page or the product’s average order value is too low to cover the ad cost.
With Bestever, you can check whether the ad’s promise lines up with the post-click experience. If you see a disconnect, you can test a stronger offer or rewrite the landing page headline to match the creative.
Scenario 2: CPM increases, but targeting stays the same
Your campaign starts at $8 CPM, then jumps to $18 a week later, even though you haven’t touched the audience or placements. This is a sign of creative fatigue. Meta doesn’t flag this clearly.
Bestever tracks when top creatives start to lose hold rate or drop below average engagement. You can swap in fresh variants before performance tanks across the board.
Scenario 3: Reels get low engagement, while static ads perform well
You use the same value prop across formats, but your Reels drive fewer clicks and conversions than static images. This often comes from slow pacing, missing hooks, or poor framing.
Bestever lets you compare video and static side by side, tagging elements like motion, product visibility, and CTAs. You can see that your Reel doesn’t show the product until second five, while the static ad puts it front and center. You now know what to fix.
Scenario 4: High add-to-cart rate, but low purchase volume
Your ad gets people to add items to their cart, but few complete checkout. This usually means friction in the funnel. Maybe the shipping cost is too high, or the checkout process is too long. Meta won’t tell you that.
Bestever helps you trace which ad creatives lead to these drop-offs, so you can isolate which audiences need retargeting and where to focus your conversion rate optimization (CRO) efforts.
Scenario 5: One hook works on Stories but fails on Feed
You reuse a winning story ad in the Feed placement, but performance drops by 40%. Meta groups both under the same asset report, so it’s hard to see what’s wrong.
Bestever breaks out performance by placement and tags differences in layout, timing, and visual cues. You learn that the hook worked in vertical format but failed in square crop because the key text got cut off.
What to use instead: Facebook Analytics alternatives
You can still track performance without Facebook Analytics, but it takes more than one tool. Meta covers in-platform campaign data, while other platforms handle post-click behavior and creative analysis.
Here’s a breakdown of what to use instead and what each tool does:
You won’t find one tool that replaces Facebook Analytics. But if you combine Meta’s native reporting with GA4, a central reporting tool like Supermetrics or Triple Whale, and Bestever for creative diagnostics, you’ll cover the full funnel.
Let’s take a deeper look into what each tool does:
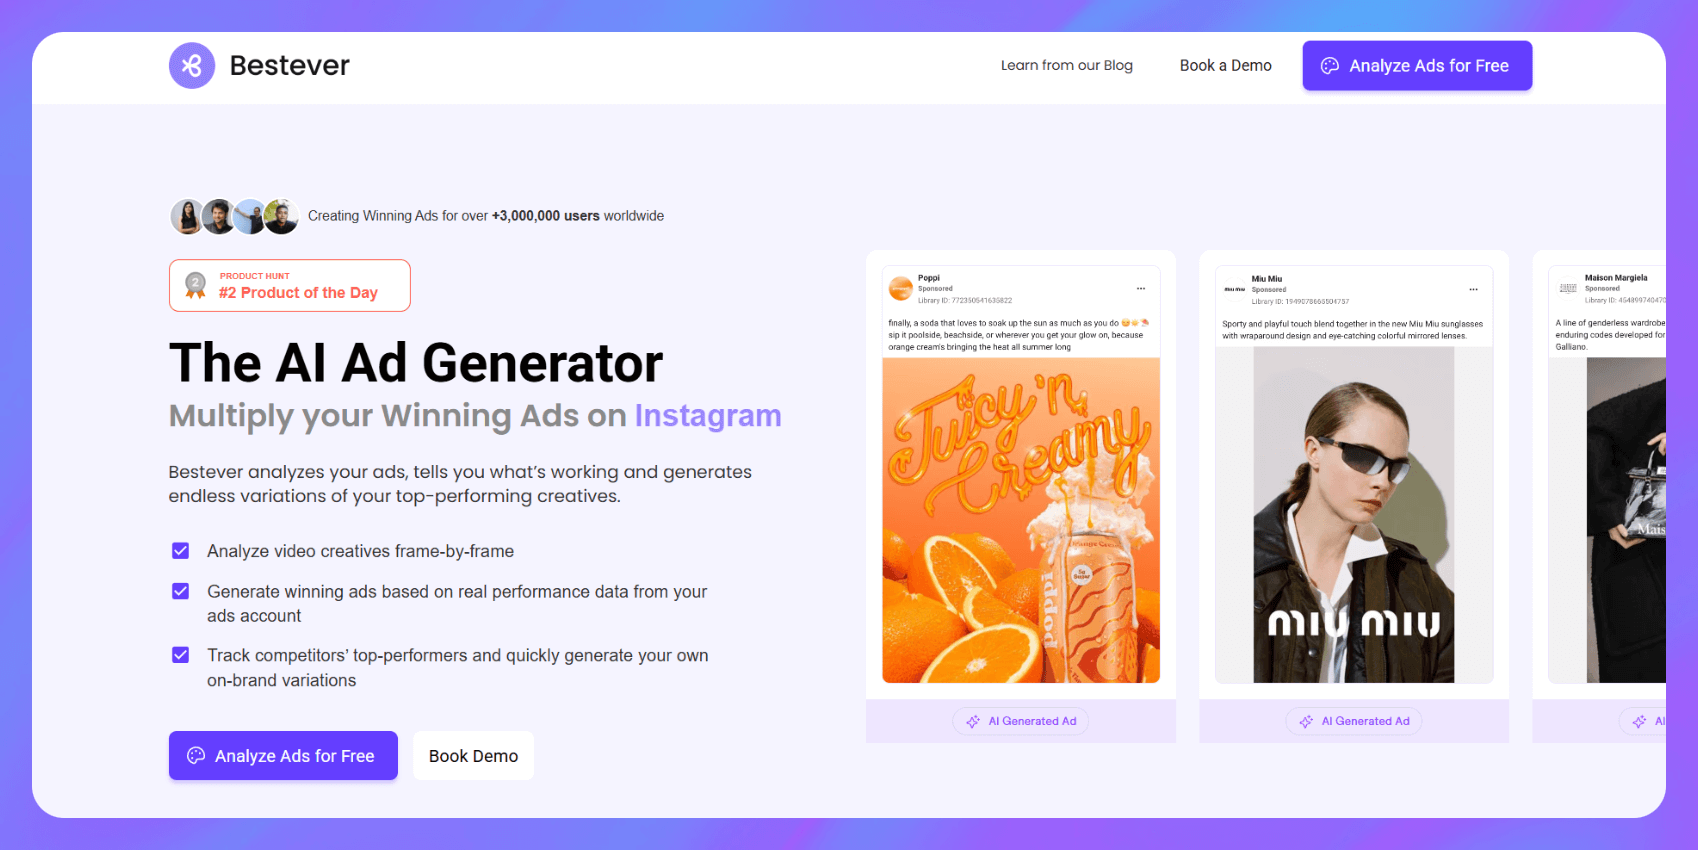
1. Bestever
- What it does: Analyzes creative performance using attention metrics, historical patterns, and visual breakdowns.
- Who it’s for: Creative strategists, media buyers, and growth teams who want to know why ads perform, and how to fix them.
Features
- Frame-by-frame creative scoring
- Attention and hold-rate tracking
- Hook tagging and visual pattern analysis
- Placement comparisons and fatigue detection
Pros
- Focuses on what Meta doesn’t show
- Helps teams act on data, not just report it
- Useful for both post-launch analysis and rapid iteration
Cons
- Requires ad account access to start
- Doesn’t replace full campaign reporting
Pricing
You can get a Bestever demo or try the tool for free for 14 days. Then, the Images Standard plan starts at $39 per month.
2. Meta Ads Manager
- What it does: Tracks ad delivery, audience performance, and top-line metrics like CTR, CPM, and ROAS.
- Who it’s for: Advertisers running Facebook and Instagram campaigns who need in-platform reporting and campaign controls.
Features
- Breakdown reports by placement, device, or audience
- Built-in A/B testing tools
- Performance views by ad set and creative
- Budget and bid controls
Pros
- Direct integration with Meta campaigns
- Real-time data updates
- Essential for campaign setup and monitoring
Cons
- No deep creative analysis
- Limited post-click insights
- Disconnected from other marketing channels
Pricing
Free to use with any Meta ad account.
3. Google Analytics 4 (GA4)
- What it does: Tracks user behavior after the ad click, including bounce rate, session duration, and purchase activity.
- Who it’s for: Marketers who want visibility into how paid traffic behaves on their website or app.
Features
- Funnel tracking and user path analysis
- Cross-platform event tracking
- Attribution modeling
- Integration with Google Ads and BigQuery
Pros
- Strong post-click insights
- Event-based tracking gives more flexibility
- Works across paid and organic channels
Cons
- Steep learning curve
- Can require developer setup for custom events
- Doesn’t directly connect to Meta ad creative
Pricing
Free for standard use. BigQuery export may create cloud storage costs.
4. Supermetrics
- What it does: Pulls data from platforms like Meta, Google, TikTok, and more into spreadsheets or BI dashboards.
- Who it’s for: Analysts and marketers who want to build custom reports in Google Sheets, Excel, or Looker Studio.
Features
- 100+ data source connectors
- Scheduled data refreshes
- Prebuilt templates for ad reporting
- Custom query builder
Pros
- Flexible and customizable
- Saves time on manual exports
- Works across multiple ad platforms
Cons
- Doesn’t include creative insights
- Setup can get complex for new users
- Requires separate visualization tools
Pricing
Starts at $29 per month (billed annually) for one data source.
5. Triple Whale
- What it does: Centralizes ecommerce performance data, combining ad spend, pixel data, profit tracking, and more.
- Who it’s for: DTC brands and ecommerce marketers who want to connect Meta performance with store-level outcomes.
Features
- Pixel tracking and attribution models
- Real-time profit dashboards
- Integration with Shopify, Meta, TikTok, Google
- Creative cockpit for asset tracking
Pros
- Designed for ecommerce
- Easy to monitor blended metrics like MER and LTV
- Good visibility into store-wide ad impact
Cons
- Limited use outside ecommerce
- Setup requires Shopify or similar platform
- Creative tools are not diagnostic
Pricing
Triple Whale offers a free forever plan. Then, the Starter plan starts at $149 per month.
Best practices for getting more from Facebook Analytics
You can improve performance by focusing on the right data and linking it to creative decisions. Even with just Meta tools and Bestever, you can find patterns that help you adjust faster and run stronger campaigns. Here’s how to get more value from your analytics setup:
Track your top KPIs over time, not just in-platform
Looking at weekly ROAS or CTR in Ads Manager can show short-term wins, but it won’t help you spot long-term patterns.
Set up a dashboard (using Google Sheets or a tool like Supermetrics) that tracks your top KPIs daily or weekly. Watch for trends like falling CTR on a high-spend campaign or rising cost per purchase after a certain frequency threshold.
Segment data by placement, format, and audience
Don’t treat all performance data the same. A headline that works on Instagram Stories might fail on Facebook Feed. Use Ads Manager breakdowns to compare performance by placement, format, and audience segment. Then use Bestever to compare creative hooks across those segments and see which visuals work best for each one.
Monitor ad fatigue and rotate creative proactively
If CTR drops and frequency climbs, your audience is getting tired of your ads. Meta doesn’t flag this clearly. Bestever tracks hold rate decay and alerts you when creative performance starts to slide. Swap in new variants before performance crashes, not after.
Align performance metrics with creative strategy
Don’t stop at “this ad got a 2% CTR.” Ask why. Look at the first three seconds of the video. Check if the CTA was clear. Use Bestever’s tag-based summaries to connect visual elements to results. For example, if videos with early product demos drive better ROAS, adjust your strategy to lead with that format.
Frequently asked questions
How do I get advanced insights on Facebook ad performance?
You can run a deeper Facebook analysis by using Meta’s tools alongside platforms like Bestever. Ads Manager shows surface-level results, while Bestever highlights what creative elements drive performance using attention tags, hold rate, and visual patterns.
Can Meta Ads Manager show creative-level performance?
Meta Ads Manager provides basic creative performance metrics like CTR and spend per asset. But it doesn’t tell you how design choices impact results. Tools like Bestever help fill the gap by breaking down visual elements and comparing them across formats.
What’s the difference between Events Manager and Ads Manager?
The difference between Events Manager and Ads Manager is that Events Manager tracks backend actions, while Ads Manager reports on campaign performance. Events Manager captures purchases, signups, and page views using pixels or the Conversions API. Ads Manager shows metrics like impressions, clicks, CTR, and ROAS. Both tools support Facebook analysis, but each focuses on a different stage of the funnel.
Is Facebook Analytics different from Meta Business Suite?
Yes, they’re different tools. Facebook Analytics was a standalone analytics platform. Meta Business Suite is primarily designed for post scheduling, messaging, and basic reporting. It doesn’t offer the same depth as a full Facebook analytics report.
What should I track beyond CPC and CTR?
You should also track ROAS, purchase conversion value, delivery patterns, and creative fatigue. Scroll depth and thumb-stop ratio aren’t in Meta by default, but you can estimate them using tools like Bestever. These insights are helpful when testing new formats or using design tools to build creative variants.
Does Facebook show creative fatigue or engagement drop-off?
Facebook doesn’t show these signals directly. You can monitor changes in CTR and frequency, but that won’t explain why performance dropped. Bestever detects fatigue by tracking hold rate, engagement decay, and visual patterns across assets.
Can Bestever help analyze Facebook ads?
Yes, Bestever gives you deeper Facebook analysis at the creative level. It tags each ad by hook type, visual style, and format, then shows which elements drive strong results. It’s helpful when pairing performance data with new ideas from your design tools.
How Bestever helps you go beyond basic Facebook analysis
Facebook Advanced Analytics is gone. Now, Meta’s native tools only give you the basics, leaving big gaps. If you're relying only on Ads Manager or Business Suite, your metrics stop at surface-level KPIs. You might see high CTR or rising CPM, but not know what caused the shift or how to fix it.
Bestever helps you go deeper. It works alongside Meta’s tools to show what creative elements drive performance, when fatigue starts, and what to test next.
Here’s how:
- Analyze your ads' effectiveness: Bestever’s Ad Analysis Dashboard gives you instant feedback on each ad’s visual impact, brand fit, adherence to ad sizes, and engagement potential. It’ll even break down each element in detail.
- Get suggestions to improve every frame: If an ad isn’t hitting the mark, ask Bestever to tell you what’s wrong and get instant, actionable suggestions on what to do to fix it. No more guessing or wasting time, your team can start fixing those issues asap.
- Understand your audience: Bestever analyzes your website, ad account, and creative history to identify the people most likely to engage. It also helps you shape messaging that aligns with Facebook advertising rules and resonates with the right segments.
- Rapid asset generation: Fetch AI-generated images, stock photos, and video clips that all fit your brand voice. Then you can share the creatives with your team to create multiple ad variations more quickly.
- Instant feedback loop: Know immediately why an ad variant underperforms, then pivot before wasting your budget.
Ready to upgrade your Facebook analytics? Let our team show you how Bestever helps you make informed creative decisions, faster.


Bestever analyzes your ads, tells you what’s working and generates endless variations of your top-performing creatives.


.png)
%20(1).png)
.png)


