What is a Good Cost Per Result for Facebook Ads? Tips for 2025
Cost per result tells you how much you’re paying for each action from your Facebook ad, like a click, lead, or purchase. But what is a good cost per result for Facebook ads in 2025? For clicks and video views, a solid range is $0.50 to $2.00. For leads or purchases, $5 to $20 is more typical, depending on your industry, audience, and funnel stage.
In this article, we’ll cover:
- What cost per result is for Facebook Ads
- Calculating your cost per result
- What a good cost per result for Facebook ads is
- What factors influence your cost per result
- Tips for lowering your cost per result
Let's jump right into what cost per result is.
What is the cost per result on Facebook Ads?
Cost per result (CPR) on Facebook Ads is the amount you pay for each action (or result) your campaign aims to generate, like a click, a purchase, or a lead.
Facebook Ads Manager displays this metric on the dashboard under “Results,” alongside cost per click (CPC), cost per thousand impressions (CPM), and return on ad spend (ROAS). Unlike CPC, which only tracks clicks, cost per result focuses on your chosen outcome.
Here are a few common examples:
- Lead generation campaigns: The result is a form submission
- Sales campaigns: The result is usually a purchase or add-to-cart
- Engagement campaigns: The result could be reactions, shares, or comments
- App install campaigns: The result is each download
Each campaign type defines “result” differently. That’s why it’s important to match your expectations with the goal you set in Ads Manager.
How to calculate cost per result (with examples)
You can calculate the cost per result by dividing the total amount spent by the number of results you got. The formula is simple:
Cost per result = Total ad spend ÷ Number of results
For example, if you spent $500 and got 200 leads, your cost per result is:
$500 ÷ 200 = $2.50 per lead
Here's how to apply this formula:
- Total ad spend: Find this in Facebook Ads Manager under "Amount Spent"
- Number of results: This appears as "Results" in your campaign dashboard and matches your campaign objective
And here’s what that might look like across different campaign types:
- Lead generation: $300 spent ÷ 100 leads = $3.00 per result
- App installs: $1,000 spent ÷ 250 installs = $4.00 per result
- Purchases: $2,500 spent ÷ 50 purchases = $50.00 per result
- Video views: $100 spent ÷ 5,000 views = $0.02 per result
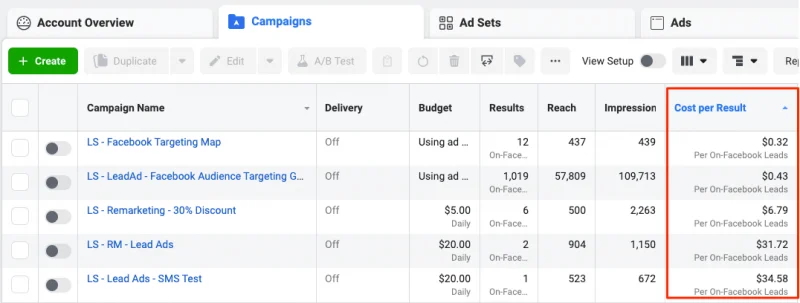
You can also view this metric directly in Meta Ads Manager. Just select your campaign and check the "Results" column. Meta automatically calculates it based on your selected optimization goal.
The key is to track it in context. A $10 lead might be acceptable for a high-ticket service, but way too high for a top-of-funnel e-book.
What is a good cost per result for Facebook ads in 2025?
A good cost per result for Facebook ads in 2025 is one that keeps your campaign profitable based on your industry, audience, and goals. Most advertisers aim for results that align with their margins and leave room to scale without overspending.
Let’s talk about cost per click (CPC), since it plays a big role in shaping your cost per result. CPC shows how much you spend to get someone to visit your site or landing page, but that’s only the first step. Cost per result includes what happens next, like a signup, purchase, or lead form submission.
If your CPC is high and your conversion rate is low, your cost per result will spike. On the other hand, a solid conversion rate can offset higher click costs. That’s why it helps to look at CPC as part of the bigger picture.
The average cost per click on Facebook for traffic campaigns is $0.77, according to WordStream’s benchmark data. That’s a good CPC for Facebook Ads, but that doesn’t mean it should be your goal. A $5 lead might work for an ecommerce store, while a B2B SaaS company might expect to pay much more.
Here’s WordStream’s latest breakdown by industry (for cost per click):
- Travel: $0.42
- Education: $0.77
- Fitness: $0.81
- Beauty and personal care: $0.94
- Finance and insurance: $1.05
Use these numbers as reference points, not rules. The real benchmark is your margin. A $10 click can still be profitable if it leads to a high-value conversion.
Facebook Ads benchmarks by industry
Many factors shape your cost per result, and one of the biggest is what you pay for each click. The higher your CPC, the more pressure there is on your landing page or offer to convert.
Ad costs on Facebook can vary a lot depending on the type of business you’re running. Industries with strong purchase intent or high-value leads usually pay more per click. Others, like entertainment or travel, often see cheaper traffic.
Here’s a snapshot of the average CPCs on Facebook by industry (based on WordStream data):
These CPCs set the floor for your cost per result. For example, if your average click costs $1 and only one in ten people convert, your CPR is already $10. On the other hand, a $2 click might still be efficient if your conversion rate is high and the result brings in strong value.
Use these numbers to understand how industry trends may affect your ad costs, but measure success based on what each result is worth to your business.
Things that influence your cost per result
Several factors affect how much you pay for each result on Facebook, including creative relevance, targeting, seasonality, campaign structure, and more. These are the five most common factors:
- Audience targeting quality: Relevant audiences lower your cost. Broad or mismatched targeting wastes spend and slows down optimization.
- Creative relevance: Clear, engaging creative performs better. Ads that don’t connect with your audience lead to higher costs and lower conversions.
- Campaign structure and objective: The goal you choose in Ads Manager matters. Optimizing for purchases with a small budget often backfires. Choosing a goal like add-to-cart or leads can give the algorithm more room to work.
- Seasonality: Ads cost more during peak times. Expect higher competition and higher costs around holidays, major sales events, and seasonal spikes.
- Learning phase: New campaigns take time to stabilize. During the learning phase, your costs will likely be higher. Once Facebook gathers enough data, performance usually improves.
If your cost per result keeps rising, revisit these five areas. Small changes can make a big difference when you’re working with a limited budget or tight goals.
Can your CPR be too high?
Yes, your cost per result can be too high — especially if it eats into your profit margins or exceeds the value of a customer to your business. The goal is to keep your costs aligned with what each result is worth.
Start by comparing your CPR to your customer lifetime value (LTV) and average order value (AOV). If you’re paying $40 per lead, but your average sale is only $35, you’re losing money. Even if you’re getting conversions, the math doesn’t work.
You should also consider where the campaign sits in your sales funnel. Top-of-funnel campaigns tend to have cheaper CPRs, but they don’t always lead to sales. Bottom-funnel campaigns cost more, but they usually deliver stronger ROI. A higher CPR might be fine if it's driving high-value conversions.
Here are some warning signs that your CPR is inefficient:
- Click-through rate (CTR) drops: Low or falling CTR means your creative or offer isn’t landing.
- Ad or creative fatigue: If frequency is climbing and performance is dropping, your audience has seen the ad too many times.
- Low relevance score: Facebook uses this to rate how well your ad fits the audience. A low score often means higher costs.
Tips for lowering your CPR (without killing performance)
You can lower your cost per result without hurting performance if you focus on the right areas. These five tactics work without forcing you to scale back your spend or start from scratch:
- Test creatives often: Rotate in new visuals, hooks, and formats. Even small changes can lift engagement and bring costs down. Start with an ad audit to review past creatives and find what’s no longer working.
- Improve your CTR: Ads with higher CTR usually cost less. Use direct language in your headlines and highlight a clear benefit. Try urgency or social proof if your engagement is low. You can also make sure your call to action is easy to follow.
- Refine your audience targeting: Targeting the right people keeps your costs stable. Use lookalikes, custom audiences, or interest-based segments. If CPR rises, check for audience overlap or split your groups into tighter segments.
- Use retargeting with intention: Retarget people who already showed interest and match your message to their stage in the funnel. Avoid using the same creative for cold and warm traffic, since they respond differently.
- Choose the right optimization goal: If you're not getting enough conversions, try optimizing for an earlier step, like add-to-cart or landing page views. Meta needs data to learn. The more results it sees, the faster your CPR drops.
You can also use ad automation to test variations, update creatives, and adjust bids. This helps you move faster without having to watch every campaign manually.
Is your ad creative causing a higher cost per result?
Yes, poorly designed creative can often be the reason your cost per result increases. Weak creative performance leads to lower engagement, higher costs, and poor conversion rates. Even a strong audience can’t save an ad that doesn’t resonate.
Start by looking at your relevance score. Meta rates how well your creative fits the audience you’re targeting. Low scores often mean your message is off, your visuals aren’t working, or your offer isn’t clear. These issues usually lead to higher costs and fewer results.
Watch for signs of ad fatigue, too. If you show the same ad too often, your audience stops engaging, and your CPR goes up.
It helps to run a creative analytics review before you launch new ads. Look at your headlines, visuals, format, and calls to action. Identify what’s working and what needs to go.
If you want a faster way to handle this, Bestever offers tools that score your assets, compare creative performance across past campaigns, and suggest what to fix. You can run these checks before you spend, so you're not wasting your budget on weak creative.
Frequently asked questions
Is the cost per result the same as the cost per click?
No, the cost per result is not the same as the cost per click. Cost per click only tracks how much you pay per click. Cost per result includes whatever outcome you optimize for, like leads, purchases, or video views.
How do I improve CPR without increasing spend?
You can improve CPR without increasing spend by testing stronger creative, refining your targeting, and picking the right campaign objective. A quick ad audit or creative refresh often helps drop costs while keeping conversions steady.
What’s a good CPR for lead gen campaigns?
A good CPR for lead gen campaigns is one that stays below the value of each lead and still allows room for profit. While WordStream reports average Facebook CPCs around $1.00 in many industries, your CPR will be higher depending on how well clicks convert into leads. Use your own lead value and close rate to decide what makes sense for your goals.
Should I care more about ROAS than CPR?
You should care about both return on ad spend (ROAS) and CPR because they measure different things. CPR tracks how efficiently you get a result, like a lead or purchase. ROAS shows whether that result is making you money. Use CPR to spot issues with targeting or creative, and use ROAS to measure profitability.
How often should I update the creative to reduce CPR?
You should update your creative whenever your CTR drops, your relevance score falls, or your frequency rises. Many brands rotate ads every 2 to 4 weeks to prevent fatigue and keep performance strong.
Is a high CPM bad if CPR is good?
A high CPM isn’t always bad if your CPR is still efficient. If your ad converts well, you can afford to pay more for impressions. But if both CPM and CPR are rising, it’s time to review your targeting or creative.
Can AI tools help lower CPR?
Yes, AI tools can help lower CPR by speeding up testing, improving targeting, and analyzing creative performance. Bestever, for example, can run creative audits, tag weak assets, and recommend edits to help you create stronger versions before you launch.
How Bestever can help you improve your Facebook Ads CPR
Knowing what a good cost per result for Facebook ads looks like is only part of the equation. The harder part is fixing it when your numbers start rising. That usually means your targeting is off, your optimization goal isn’t right for your funnel, or your creative isn’t optimized.
Bestever can help you optimize your creatives by showing you exactly where your ads are falling short and what to change before you waste more budget.
Here’s how:
- Analyze your ads' effectiveness: Bestever’s Ad Analysis Dashboard gives you instant feedback on an ad's visual impact, brand alignment, sales orientation, and audience engagement. It’ll even break down each element in detail.
- Get suggestions to improve every frame: If an ad isn’t hitting the mark, ask Bestever to tell you what’s wrong and get instant, actionable suggestions on what to do to fix it. No more guessing or wasting time — your team can start fixing those issues asap.
- Understand your audience: Bestever’s audience analysis tools go beyond sharing standard demographics, helping refine both targeting and messaging. You can share your website URL or integrate it with your ad manager, and it’ll quickly let you know who wants to hear more from you.
- Rapid asset generation: Fetch AI-generated images, stock photos, and video clips that all fit your brand voice. Then you can share the creatives with your team to make multiple ad variations faster.
- Instant feedback loop: Know immediately why an ad variant underperforms, then pivot before wasting your budget.
Ready to lower your cost per result and improve creative performance? Let our team show you how Bestever can spot what’s holding your ads back and help you fix it before it costs you more.


Bestever analyzes your ads, tells you what’s working and generates endless variations of your top-performing creatives.


.png)
%20(1).png)
.png)


